 PivotStats
AI-driven pivot research
PivotStatsThe floor trader's map,
rebuilt for today.
Decades of pivot knowledge, connected to modern data, research and AI. Explained clearly.
Not signals. Not promises.

Market map
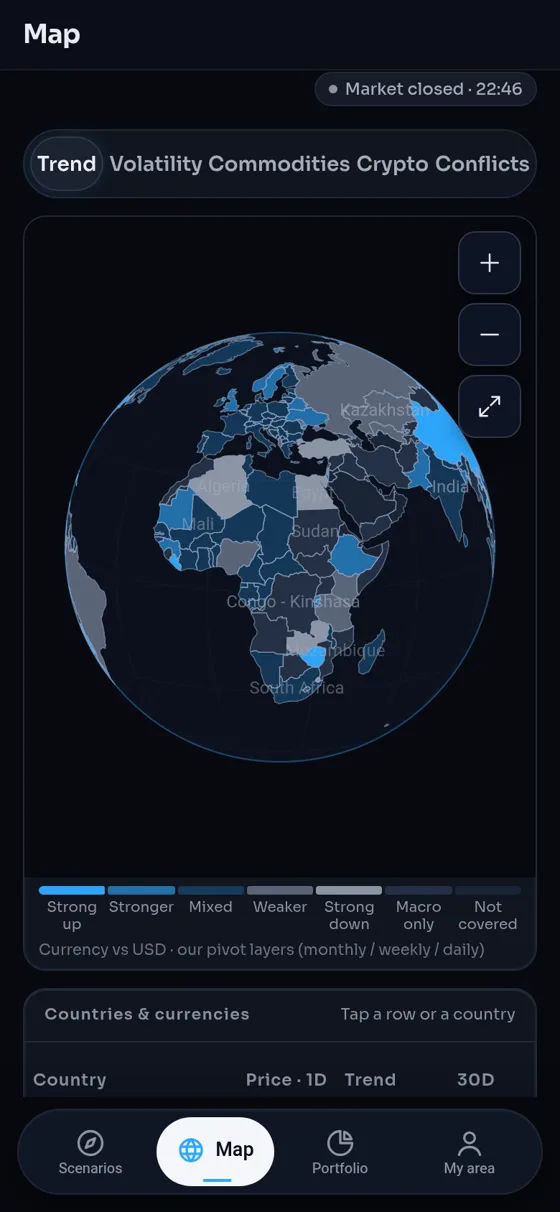
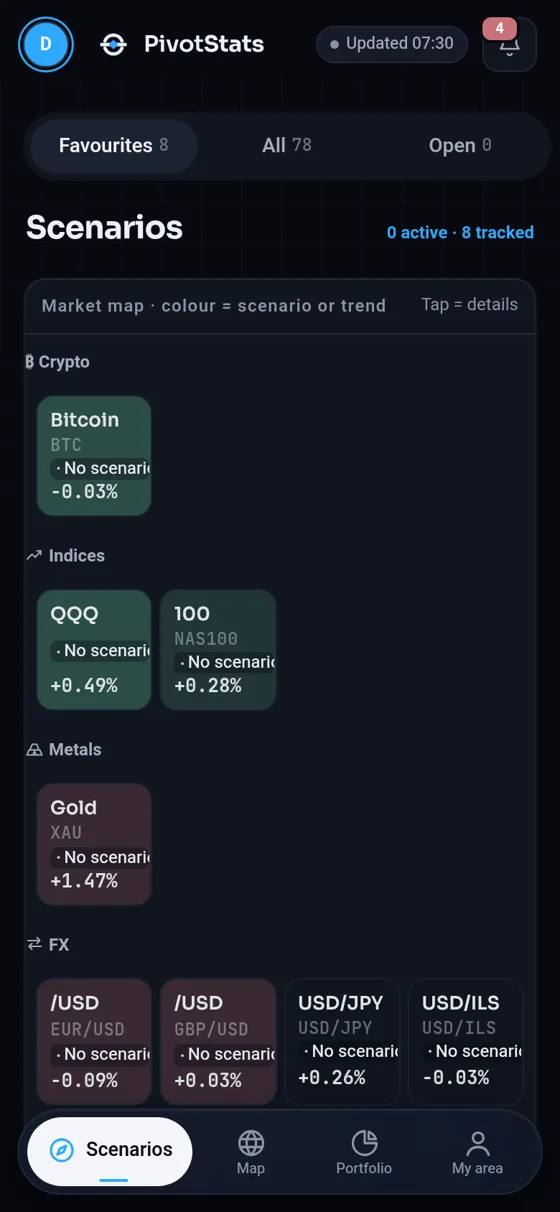
The whole market, at a glance.
Tiles colored by direction, the same way they look inside the app.
Illustration · demo data, not live prices
Our mission
We bring the trading floor to your phone.
We're building one of the deepest research engines in trading: decades of market history across stocks, indices, FX, commodities, crypto and bonds, studied event by event. Then our AI turns it into something anyone can read in seconds. Not signals. Not hype. A clearer way to understand the market. And we're just getting started: our research never stops, and every new finding makes the app sharper.
The levels that matter
Pivots in five methods across yearly, monthly and weekly timeframes, CPR and key zones, mapped across every major market.
The full context
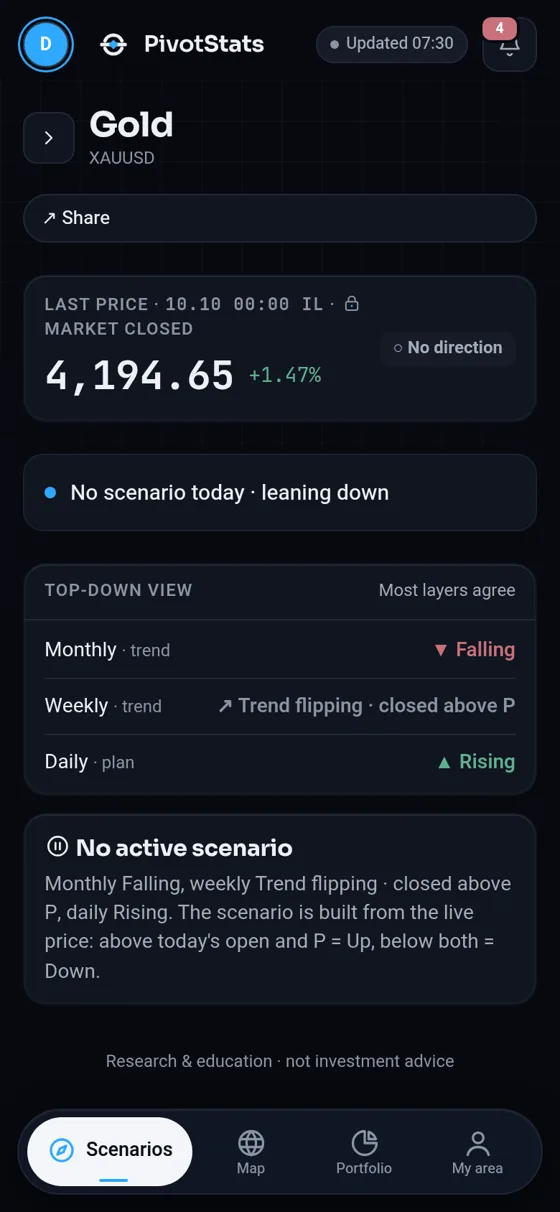
Trend across yearly, monthly and weekly timeframes, EMA, RSI, momentum and market structure, read together, not in isolation.
AI scenarios in plain words
Where price may react, where the idea breaks, what to watch next. Every day, for every asset.
The whole market, live
A 3D globe and market map that show where the action is, at a glance.
Alerts with the plan attached
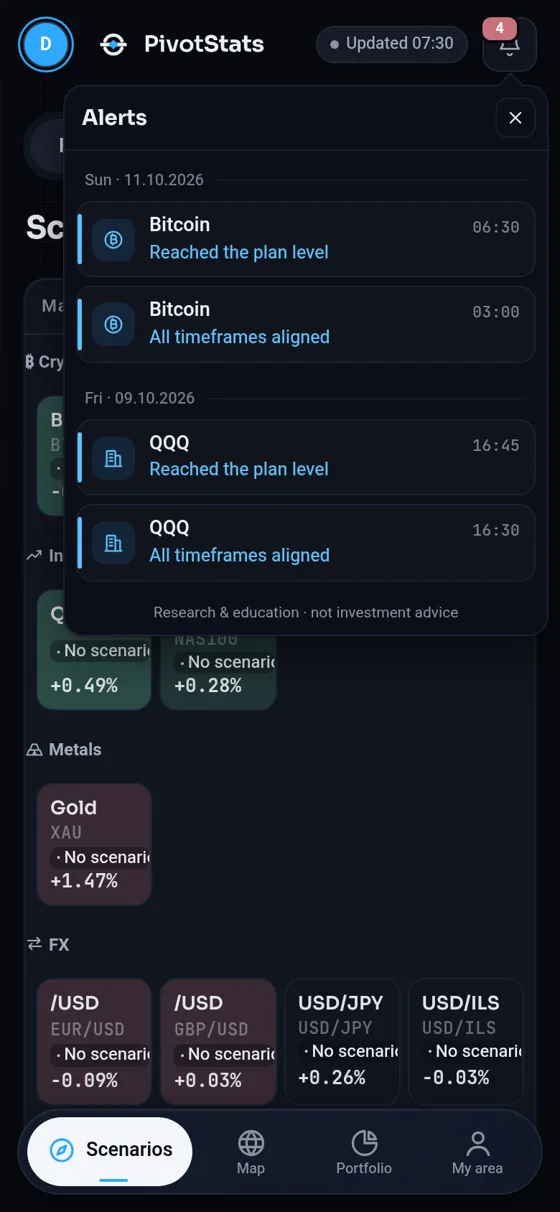
Only when it matters, straight to your inbox in the app.
What's next
This is only the beginning. Whale-flow maps, new research-driven tools and native apps for iOS and Android are on the way.
The app
Inside Telegram. Nothing to install.
Ready? Open PivotStats in Telegram.
Open in TelegramNative apps are on the way.
iOS and Android apps are in preparation. Until then, PivotStats runs right inside Telegram.